Spend Intelligence
Track all food spending — groceries, restaurants, delivery
Cost-per-nutrient analysis, store comparisons, and budget intelligence that no other app can provide.
The Insight Nobody Else Can Give You
Cost per gram of protein. Cost per 100 calories. Cost per micronutrient.
Why This Is Impossible For Competitors
Calculating cost-per-nutrient requires verified nutrition data and verified price data simultaneously. Eatomate has both because receipt scanning captures prices at the exact moment pantry items are added with full nutritional profiles.
Other Nutrition Apps
Have nutrition data but no price data. Cannot calculate cost per nutrient.
Banking Apps
Have price data but no nutrition data. Cannot tell you which purchases are nutritionally efficient.
Eatomate ✓
Receipt scan → price captured. Pantry item → nutrition verified. Result: cost per gram of protein, fat, carbs, and 27 micronutrients. Impossible to replicate without both datasets.
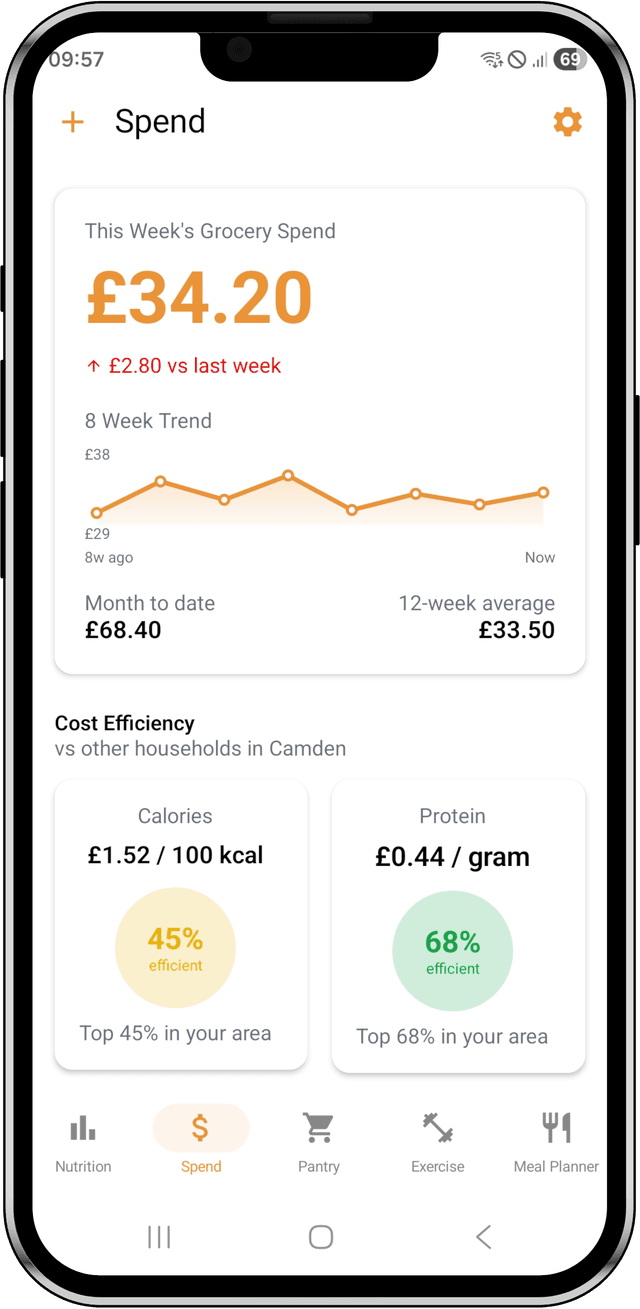
See Your Total Food Spending at a Glance
This week's total spend with week-over-week change. Track all food spending—groceries, restaurants, meal delivery—automatically from receipt scans.
"£127.40 this week, up £12.30 from last week"
Sparkline showing spend fluctuations over time
Month-to-date and 12-week average for context
Cost Efficiency Cards: Below the hero stat, see cost per gram of protein, fat, and carbs — with borough percentile rankings showing how you compare to neighbors.
What Spend Insights Show You
Four intelligence layers that turn receipt data into actionable insights
Total Weekly & Monthly Spend
Track every pound spent on groceries automatically. Weekly trend, month-to-date, rolling 12-week average. No manual entry. No spreadsheets.
Example: "You spent £127.40 this week, up £12.30 from last week. Your 12-week average is £115.20."
Cost-Per-Nutrient Analysis
See exactly what you pay per gram of protein, fat, and carbs. Borough percentile rankings show how your efficiency compares to neighbors.
Example: "Your protein costs £0.09/gram. You're in the top 87% for protein efficiency in Camden."
Sortable Category Breakdown
Spending by food category (protein sources, vegetables, dairy, grains). Sort by total spend OR cost-per-nutrient across 5 sort modes. Bars re-scale when you switch.
The insight: "You spent £8.90 on spices this week. When sorted by cost per gram protein, spices appear first—zero protein per pound spent."
Store Comparison Intelligence
Shop at multiple stores? Eatomate tracks which store gives you the best nutrition per pound. No manual comparison needed.
Example: "Lidl protein: £0.06/g average. Waitrose same protein: £0.14/g. Shopping at Waitrose costs £18 more per week for identical nutrition."
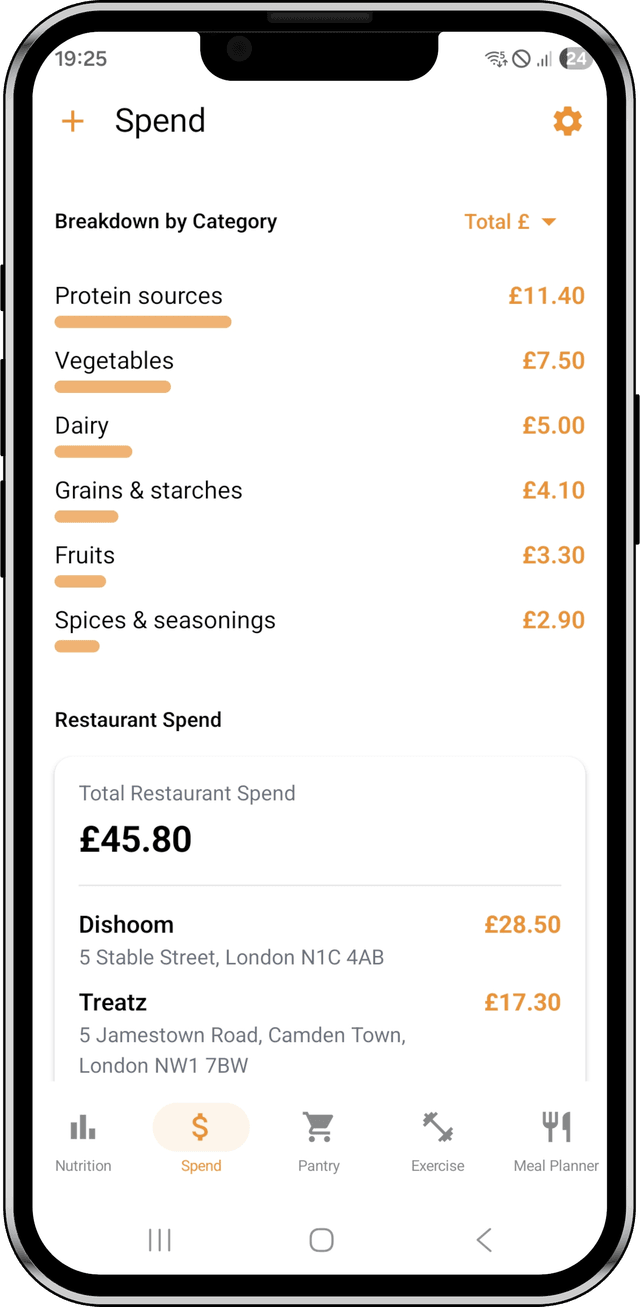
Spending by Category — Sortable 5 Ways
See spending broken down by food taxonomy (protein sources, vegetables, dairy, grains). Switch between 5 sort modes to find inefficiencies.
See which categories get the most budget
Find the most efficient protein sources in your diet
Identify where your fat spend is going
Compare carbohydrate costs across categories
Overall energy efficiency — £ per 100 calories
The "aha" moment: When you change sort from "Total spend" to "Cost per gram protein", the bars re-order and re-scale. Categories that were tiny bars (low spend) become the longest bars (high cost per gram = worst efficiency).
Spices go from £2.90 total spend (small bar) to £2.40/g protein (longest bar). Protein sources go from £11.40 total spend (longest bar) to £0.09/g protein (shortest bar = most efficient).
How Receipt Scanning Powers Spend Insights
Zero additional effort. Pure data mining.
Step 1: Receipt Scan Captures Price + Item
When you scan a grocery receipt for pantry tracking, the OCR engine extracts item names and prices. "TESCO MLK ORG 2L £2.50" → item matched to pantry, price recorded automatically.
You're scanning the receipt to populate your pantry. Price data is captured as a side effect. Zero additional user effort.
Step 2: Nutrition Data Linked to Price
Every pantry item has verified nutritional data—macros, micronutrients, verified portion weights. The receipt links price to this exact nutrition profile. Now you know: £2.50 bought you 68g protein, 16g fat, 96g carbs.
Result: cost per gram of protein = £2.50 / 68g = £0.037/g. This calculation is impossible without both datasets simultaneously.
Step 3: Aggregation Across All Receipts
Every receipt you scan adds to the dataset. Week 1: one receipt, rough estimates. Week 12: 12 receipts, clear spending patterns. Cost-per-nutrient trends emerge. Store comparisons become statistically significant.
Borough percentile rankings require 5+ users in your area. Once that threshold is crossed, you see: "You're in the top 87% for protein efficiency in Camden".
Why This Matters
Real budget optimization from verified data
Discover Budget Leaks
Most people have no idea where their grocery money goes. Eatomate tracks every pound automatically—weekly shops, convenience stores, meal deals, coffee shop snacks.
Common discovery: "I thought I spent £200/month on groceries. Eatomate showed £340. The extra £140 was convenience store purchases I forgot I was making."
Optimize Protein Sources
See which protein sources give you the best value. Eggs: £0.06/g. Chicken breast: £0.08/g. Protein bars: £0.18/g. Make data-driven swaps without sacrificing nutrition.
Real savings: "Switched from branded protein bars to Greek yogurt + eggs. Same 150g protein per week. £85/month saved."
Compare Stores With Data
Shop at multiple stores? The system automatically tracks cost-per-nutrient across all of them. See which store is actually cheaper for your specific shopping patterns.
Coming soon: "Lidl gives you identical nutrition for £18/week less than Waitrose based on the foods you actually buy."
Budget Cutting Without Nutrition Loss
When you need to cut spending, sort categories by cost-per-nutrient instead of total spend. Identify which purchases deliver poor nutrition per pound—cut those first.
Example: "Ready meals: £0.35 per 100 kcal. Home-cooked rice + chicken: £0.12 per 100 kcal. Cooking at home saves £160/month for identical nutrition."
Complete Intelligence for Your Health & Budget
Track food spending with cost-per-nutrient analysis, and close the energy balance loop with MET-based exercise tracking. One app, complete metabolic intelligence.
Spend Intelligence
Track every pound spent on food. Cost-per-nutrient analysis, store comparisons, and budget optimization from receipt scans.
Exercise & Energy Balance
MET-based exercise tracking, TDEE breakdown, body composition, and personalized metabolic learning.
Meal Planner
Plans built from your actual pantry, expiry dates, and nutrition targets. Smart grocery lists that only add what you need.
Zero Additional Effort
Spend insights from receipt scans you already do. Exercise logging in 30 seconds. No wearables required.
All insights included in every Eatomate plan. 30-day free trial. No credit card required. Cancel anytime.